Hi, I'm David Weisglass
I'm a student researcher and artist connecting these two distinct worlds with the goal of connecting people—whether through health data, cultural artworks, or gamifying educational topics
Latin American Dysbiosis Index (LADI)
Magna sed etiam consequat, et lorem adipiscing sed nulla. Volutpat nisl et tempus et dolor libero, feugiat magna tempus, sed et lorem adipiscing.
Chakana App—Peruvian Cultural Preservation
Etiam tristique libero eu nibh porttitor amet fermentum. Nullam venenatis erat id vehicula ultrices sed ultricies condimentum.
NASA Microbiome Research in Spaceflight
Ultrices dolor amet ultricies et condimentum. Magna sed etiam consequat, et lorem adipiscing sed dolor sit amet, consectetur amet do eiusmod.
For any inquiries, please contact me
My Art Portfolio

Peruvian Thread

La Abuela y El Perro

Chullo Hat

Zichrona Livrocha
Old City of Jerusalem

Incan Embroidery

Keter

Cultural Ties to Foods

Ein Sof - Inti

Amaru

Monochrome Condor
Donny
La Vivencia

An Incan Portrait
Pachamama

Tallit

Street Dog

Quipu
New York Skyline
Branching Out
All Used Up

Kavod
El Condor
Southwest Graphic


Contact Me
Latin American Dysbiosis Index (LADI)
Welcome to the Latin American Dysbiosis Index (LADI) project — a human-centered research initiative that combines computational biology, machine learning, and cultural research to better understand the impact of industrialization and westernization on gut microbiota across Latin America.
This project investigates how shifts in lifestyle and diet influence gut microbiome composition by leveraging:- Publicly available microbiome sequencing data (saMBA (South American Microbiome Archive))
- Random forest and nearest centroid classifiers (NCC)
- Dimensionality reduction and diversity metrics (e.g., Bray-Curtis)
- A novel Industrialization Index for visualization and diagnostic insightsThe goal is to lay the foundation for a culturally grounded Latin American dysbiosis diagnostic tool, informed by machine learning, microbiome data, and public health perspectives.
Inspired by personal experiences and cultural heritage, this project explores how urbanization and dietary shifts in Latin American communities may be altering microbial health. By investigating these changes quantitatively, I aim to empower culturally specific health tools that respect traditional food practices and biodiversity.
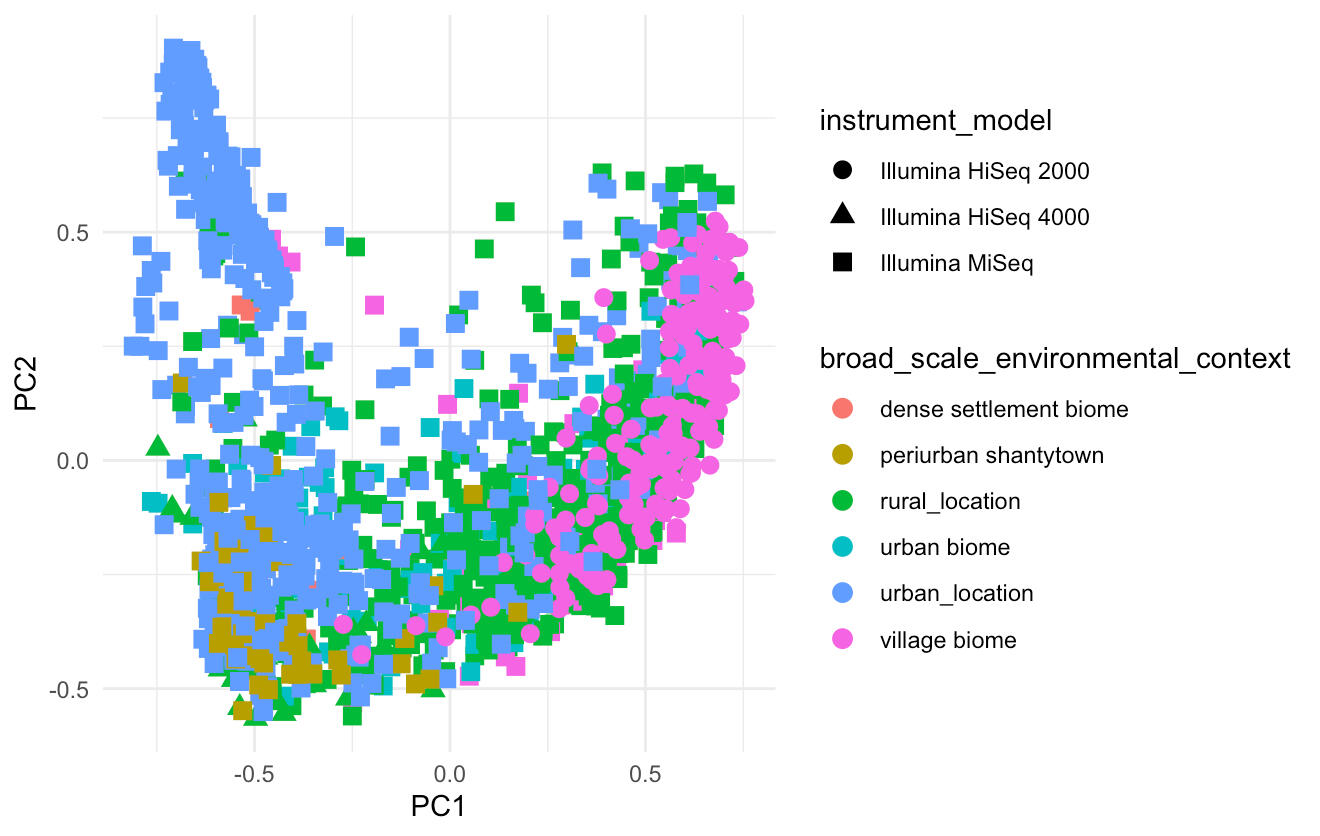
Graphical representation of the statistical variation of data derived from various environmental contexts
1. Data Preprocessing
- Filtered raw genus-level count tables from public microbiome datasets
- Removed low-prevalence taxa
- Applied log-transformation and pseudocount smoothing
2. Industrialization Labeling
- Samples were categorized into "More Industrialized" and "Less Industrialized" based on the metadata's "broad _ scale _ environmental _ context."
3. Random Forest Classification
- Trained a 1000-tree model to distinguish industrialization classes
- Achieved ~77.5% accuracy on test set
Identified top microbial genera contributing to classification
4. Nearest Centroid Classification (NCC)
- Computed class centroids in microbiome space
- Calculated Euclidean distances for each sample to centroids
- Potential to create a continuous Industrialization Index ranging from 0 (rural-like) to 1 (urban-like)
5. Statistical Analysis
- PERMANOVA & ANOVA to assess community differences across biomes
- Tukey's HSD for post-hoc comparisons
Key Findings- Significant microbiome differences were detected across environmental contexts (p < 0.001).
- The NCC-based index offers an interpretable and intuitive visualization of "microbial urbanization".
- Top genera contributing to industrialization-related differences include Prevotella, Bacteroides, and Ruminococcus species.
Next Steps- Refine the index to account for specific regional dietary practices
- Interview Latin American individuals about traditional food and health practices
- Build a demo web interface for the Dysbiosis Index